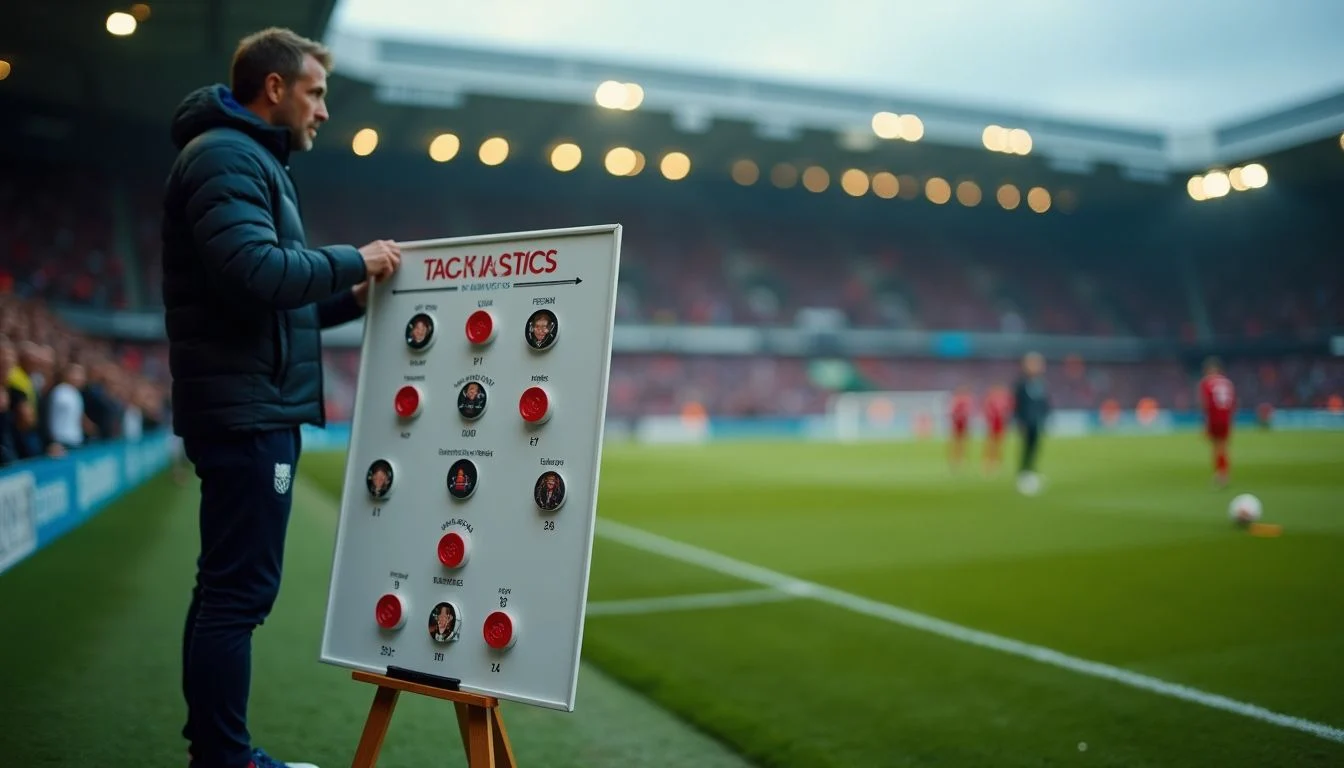
The question of zonal or man marking corners cannot be settled by counting goals conceded, and no lineup or event data was available for this analysis to claim otherwise. ESPN has argued that raw totals for both systems are inconclusive because they ignore how many corners each side faces, a point that shapes everything below.
The sources do offer some firm reference points. The Premier League‘s own analysis describes Manchester City’s 2022/23 setup as a five-man arc around the goalkeeper, four players in 1v1 duels and one spare player, and credits it with one corner goal conceded. Opta data cited by Sky Sports show inswinging corners producing far more Premier League goals than outswingers in 2025/26, partly because they are delivered more often. This piece sets out what those figures support, and what they do not.
Quick answer: No stored match, lineup or event data supports declaring zonal or man-marking better at corners. ESPN argues that raw goals-conceded totals are inconclusive because they ignore how many corners each side faces. Opta data cited by Sky Sports show 77 Premier League goals from inswinging corners against 11 from outswinging corners in 2025/26, though part of that gap reflects more inswinging deliveries, and those figures still need checking against the full article.
Why raw corner-goal counts mislead
The simplest way to judge a corner defence is to count the goals it concedes. It is also the least reliable. ESPN made the point in an editorial in 2014: totals of goals conceded from corners say little about zonal versus man-marking, because they ignore how many corners each side faces. A team that concedes four goals from 40 corners and one that concedes four from 90 have not defended the same way, yet the raw count treats them as equals.
The same problem sits inside delivery type. Sky Sports, citing Opta data, reported 77 Premier League goals from inswinging corners against 11 from outswinging corners in 2025/26. Part of that gap reflects the higher volume of inswinging deliveries, so the numbers do not show that an inswinger is seven times as dangerous per corner. Per-delivery rates would be needed, and the excerpts we have do not provide them. These figures also need checking against the full Sky Sports article before they are treated as final.
History offers a further warning. ESPN reported that Liverpool under Rafa Benitez published figures showing the fewest corner goals conceded in two separate seasons, and treated them as inconclusive without corner volume. That claim is roughly twelve years old and should be read as ESPN’s account, not as a verified record.
Context matters too. The Premier League’s own analysis cited Manchester City as conceding one corner goal in 2022/23, using a five-man arc around the goalkeeper, four players in 1v1 duels and one spare player. A third-party page gives a different figure, three goals from 129 corners, but its period is unclear, so the two numbers cannot be combined or compared.
In our view, the sound reading is cautious: none of these figures, on its own, makes zonal or man-marking the better system.
Shape and setup: what the sources can and cannot show
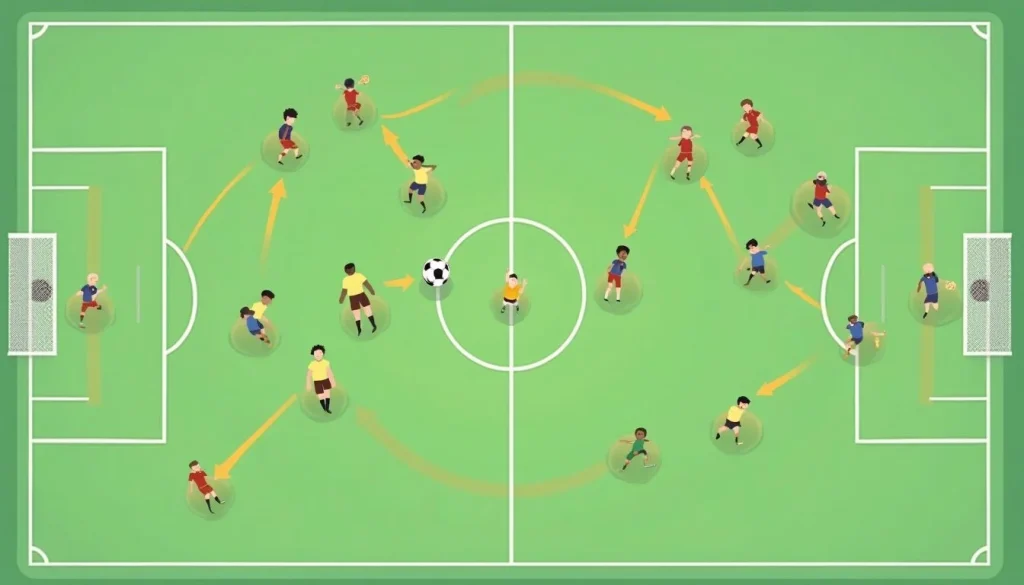
No lineup, match or event record is stored for this article, so no formation can be assigned to any team here. The sources describe marking roles, not shapes, and that is the only level at which corner setups can be discussed honestly.
The vocabulary is simple. Zonal marking assigns defenders to areas of the box. Man-marking assigns each defender an opponent. A hybrid mixes the two. According to Sky Sports in 2016, Danny Higginbotham favours a hybrid system over a purely zonal or purely man-marked one. That is a reported view; the exact wording has not been checked against the original piece, so it is paraphrased rather than quoted.
The one concrete setup in the sources comes from the Premier League’s own analysis, published on 12 December 2022. It describes Manchester City in 2022/23 with a five-man arc around the goalkeeper, four players in 1v1 duels and one spare player. City conceded one goal from a corner that season, according to that analysis.
That is a hybrid in practice: a zonal screen at the front, man-to-man duels behind it. In our view, it shows how blurred the zonal and man-marking labels become once a setup is described in detail.
In possession: which delivery types the numbers support
The attacking side of the corner is where the numbers say most. According to Opta data cited by Sky Sports in January 2026, Premier League teams scored 77 goals from inswinging corners in 2025/26, against 11 from outswinging corners. That is a ratio of seven to one, but the source indicates that part of the gap reflects volume: inswingers are delivered more often, so they have far more chances to produce goals. The figures say nothing on their own about which delivery is more dangerous per corner taken. Our reading is that the headline split overstates the difference in quality, and a goals-per-delivery rate would be the fairer test. That rate has not been published in the material we have.
The same caution applies to the totals. The Sky Sports piece reports that Bournemouth conceded 14 set-piece goals in 2025/26 and Liverpool 13, joint-second highest in the league. These cover all set pieces, not corners alone, and they carry no corner counts, which is the problem ESPN raised about raw tallies. Over a longer span, Premier League set-piece goals were stable: 227, 225, 217 and 226 from 2012/13 to 2015/16, according to Sky Sports.
Editorial diagram, not a photograph: an inswinging corner curls toward the goal and the goalkeeper, while an outswinging corner curls away from them toward the edge of the area.
As general tactical explanation rather than stored match evidence, an inswinger asks the goalkeeper and defenders to deal with a ball moving toward goal, while an outswinger tends to favour attackers arriving from deeper. No event data has been retrieved to show which runs or routines produced the 77 or the 11, so we do not describe them.
Out of possession: blockers, chaos and set-piece pressure
The Premier League’s own analysis, published on 12 December 2022, describes what opponents try to do against man-marking sides: create chaos, often by using blockers to disrupt the defenders assigned to their runners. That is the central weakness of a 1v1 system. Each defender depends on a clear route to his man, and one obstructed route can unsettle the whole arrangement.
The same analysis shows how a side can plan for it. Manchester City conceded one goal from a corner in 2022/23, using a five-man arc around the goalkeeper, four players in 1v1 duels and one spare player. In our view, the spare player is the notable detail, since an extra defender is a plausible answer to blockers, though the excerpt does not say that was its purpose. A third-party page, The Playbook, puts City at three goals from 129 corners with zonal setups. That conflicts with the Premier League figure and the periods may differ, so the two are not combined here.
The analysis also states that a side managed by Steve Cooper had conceded five corner goals. The excerpt does not name the club, so we do not name it either.
Set-piece conceding by club
According to Sky Sports, Liverpool conceded 13 set-piece goals in 2025/26, joint-second highest in the Premier League behind Bournemouth on 14. Those totals cover all set pieces rather than corners alone, and they say nothing about how many corners each side faced or which marking system produced them. As ESPN argues, raw counts without volume are inconclusive.
No pressing or block statistics were retrieved for this article, so we do not describe any side’s pressing system or defensive block.
Transitions: what the event data does not yet show
Transitions are the part of corner defending that this article cannot test. No event-level data was retrieved, so there is no record here of what happened after a corner was cleared, who was caught upfield, or whether any side broke at speed. We therefore describe no counter-attacking structure for any team.
Checking it properly would need two things. The first is event sequences that link each corner to what follows: the first clearance, the next possession, and any shot or goal within a set window. The second is the number of corners each side faces. ESPN’s point about volume applies here too, since a side that concedes few counters after corners may simply face few corners.
The sources read for this piece, including the Premier League’s own analysis of corner defending, cover goals conceded from set pieces and marking systems. They do not cover what happens in the seconds after the ball leaves the box. In our view, that gap is the main limit on any claim about transitions at corners, and it is a reason for caution rather than a conclusion either way.
Editorial verdict: no winner on goal counts alone
This section is MatchOf’s editorial view, not a finding from the sources. In our view, the material gathered here does not show that zonal marking or man-marking is the better way to defend a corner. The reason is the one ESPN gave in 2014: raw totals of goals conceded from corners ignore how many corners each side faces. A team that concedes few goals may simply have faced few deliveries.
The examples cited in this article show why. The Premier League’s analysis credits Manchester City with one corner goal conceded in 2022/23, using a five-man arc around the goalkeeper, four players in 1v1 duels and one spare player. A third-party page puts City at three goals from 129 corners with zonal setups. The two figures conflict and the periods may differ, so we do not combine them or treat either as a verdict on a system. The Benitez-era Liverpool figures, which showed the fewest corner goals conceded in two separate seasons, are treated by ESPN as inconclusive for the same reason.
Delivery type adds a second distortion. Opta data cited by Sky Sports show 77 Premier League goals from inswinging corners against 11 from outswingers in 2025/26. Part of that gap reflects how much more often inswingers are taken, so the numbers describe habits as much as danger.
On the middle ground, Danny Higginbotham, writing for Sky Sports, favours a hybrid system over purely zonal or purely man-marking. That is his view, and the sources do not test it against the alternatives.
The fair conclusion is a limited one. A convincing comparison would need corner volume, delivery type and the marking scheme for each goal. Until the data is set out that way, a league table of corner goals conceded is a poor guide to which system works.
Related articles



Sources
- Which clubs are best at defending corners and why · Retrieved October 13, 2026
- Champions League Official Live football scores & Fantasy · Retrieved October 25, 2026
- Why the hate for zonal marking? – ESPN · Retrieved October 13, 2026
- Zonal marking or man-to-man? Danny Higginbotham explains · Retrieved October 13, 2026
- Arsenal and Liverpool rank as best and worst from set-pieces as Premier League clubs embrace trend – Between the Lines · Retrieved October 13, 2026
- Zonal Vs Man Marking · Retrieved October 13, 2026
- Zonal or Man Marking? The Best Marking System From Corners · Retrieved October 13, 2026
- Zonal Marking in England · Retrieved October 13, 2026
- Premier League Corners: Analysing The Decline Of Man-Marking · Retrieved October 13, 2026
- Why the hate for zonal marking? – ESPN · Retrieved October 25, 2026
- Benitez refuses to play blame game as errors prove · Retrieved October 25, 2026
- Zonal Marking: It's not as evil as you think it is · Retrieved October 25, 2026
- rafa benitez slams var celta vigo defeat were not talking ping pong · Retrieved October 25, 2026
- Liverpool Set Piece Analysis 2024/25: Aaron Briggs Corner Tactics · Retrieved October 25, 2026
- THE JURY IS OUT ON KLOPP’S DEFENCE · Retrieved October 25, 2026
- ‘Use our heads to ease team’s set-piece woes’ · Retrieved October 25, 2026
- Corner kick · Retrieved October 13, 2026




Leave a Reply